
Real-time SignalR Dashboard
The Deck: Mission Control
The Deck - встроенный admin dashboard ChokaQ: Blazor Server application, который дает real-time monitoring и operational control. Без отдельного deployment, без external tools: он работает внутри вашего ASP.NET Core process.
Setup
// Program.cs
builder.Services.AddAuthentication(/* your scheme */);
builder.Services.AddAuthorization();
builder.Services.AddChokaQTheDeck();

var app = builder.Build();
app.MapChokaQTheDeck();  // Dashboard available at /chokaq
По умолчанию The Deck требует default authorization policy host application. Для local-only demo или intentionally public sandbox нужно явно opt in:
builder.Services.AddChokaQTheDeck(options =>
{
    options.AllowAnonymousDeck = true;
});
Architecture: Blazor Server + SignalR
Почему Blazor Server?
- UI logic выполняется на server, отдельный API layer не нужен.
- Direct access к
IJobStorageчерез DI. - SignalR connection уже установлен Blazor'ом, zero extra config.
- Real-time updates driven by SignalR, а bounded storage reconciliation остается correctness fallback.
Dashboard panels
Stats Bar
Aggregated counters из StatsSummary + live counts из JobsHot:
| Metric | Source | Update |
|---|---|---|
| Pending | COUNT(*) FROM JobsHot WHERE Status=0 | On every job state change |
| Buffered | COUNT(*) FROM JobsHot WHERE Status=1 | On fetch |
| Processing | COUNT(*) FROM JobsHot WHERE Status=2 | On process start/end |
| Succeeded | StatsSummary.SucceededTotal | On archive (O(1) read) |
| Failed | StatsSummary.FailedTotal | On DLQ move (O(1) read) |
| Throughput | MetricBuckets via GetSystemHealthAsync() | Dashboard refresh |
| Failure Rate | MetricBuckets via GetSystemHealthAsync() | Dashboard refresh |
Operational health snapshot
The Deck читает IJobStorage.GetSystemHealthAsync() для production-oriented signals, на которые lifetime counters не отвечают:
- Queue lag: average и maximum wait time для eligible Pending jobs per queue.
- Throughput: jobs processed per second за последние 1 minute и 5 minutes.
- Failure rate: failed vs processed percentage за те же windows.
- Top errors: top 5 recent DLQ error families, grouped by
FailureReasonи normalized error prefix.
SQL Server implementation держит эти reads bounded и index-friendly. Queue lag считается из Pending hot rows через dedicated filtered index, throughput/failure rate берутся из rolling MetricBuckets, а top-error grouping ограничен recent DLQ sample, чтобы dashboard во время incident не стал accidental full-history analytics workload.
См. Rolling Observability Buckets для архитектурного урока перехода от direct Archive/DLQ lookbacks к materialized outcome buckets.
Consistency model
The Deck считает IJobStorage canonical source of truth после каждой operator mutation. Он не decrement'ит counters локально после retry, purge, cancel или edit commands, потому что на эти commands влияют filters, ownership guards, concurrent workers и row-level outcomes. Вместо этого page ждет завершения command path и reload'ит summary counters, health, circuit state и current table slice из storage.
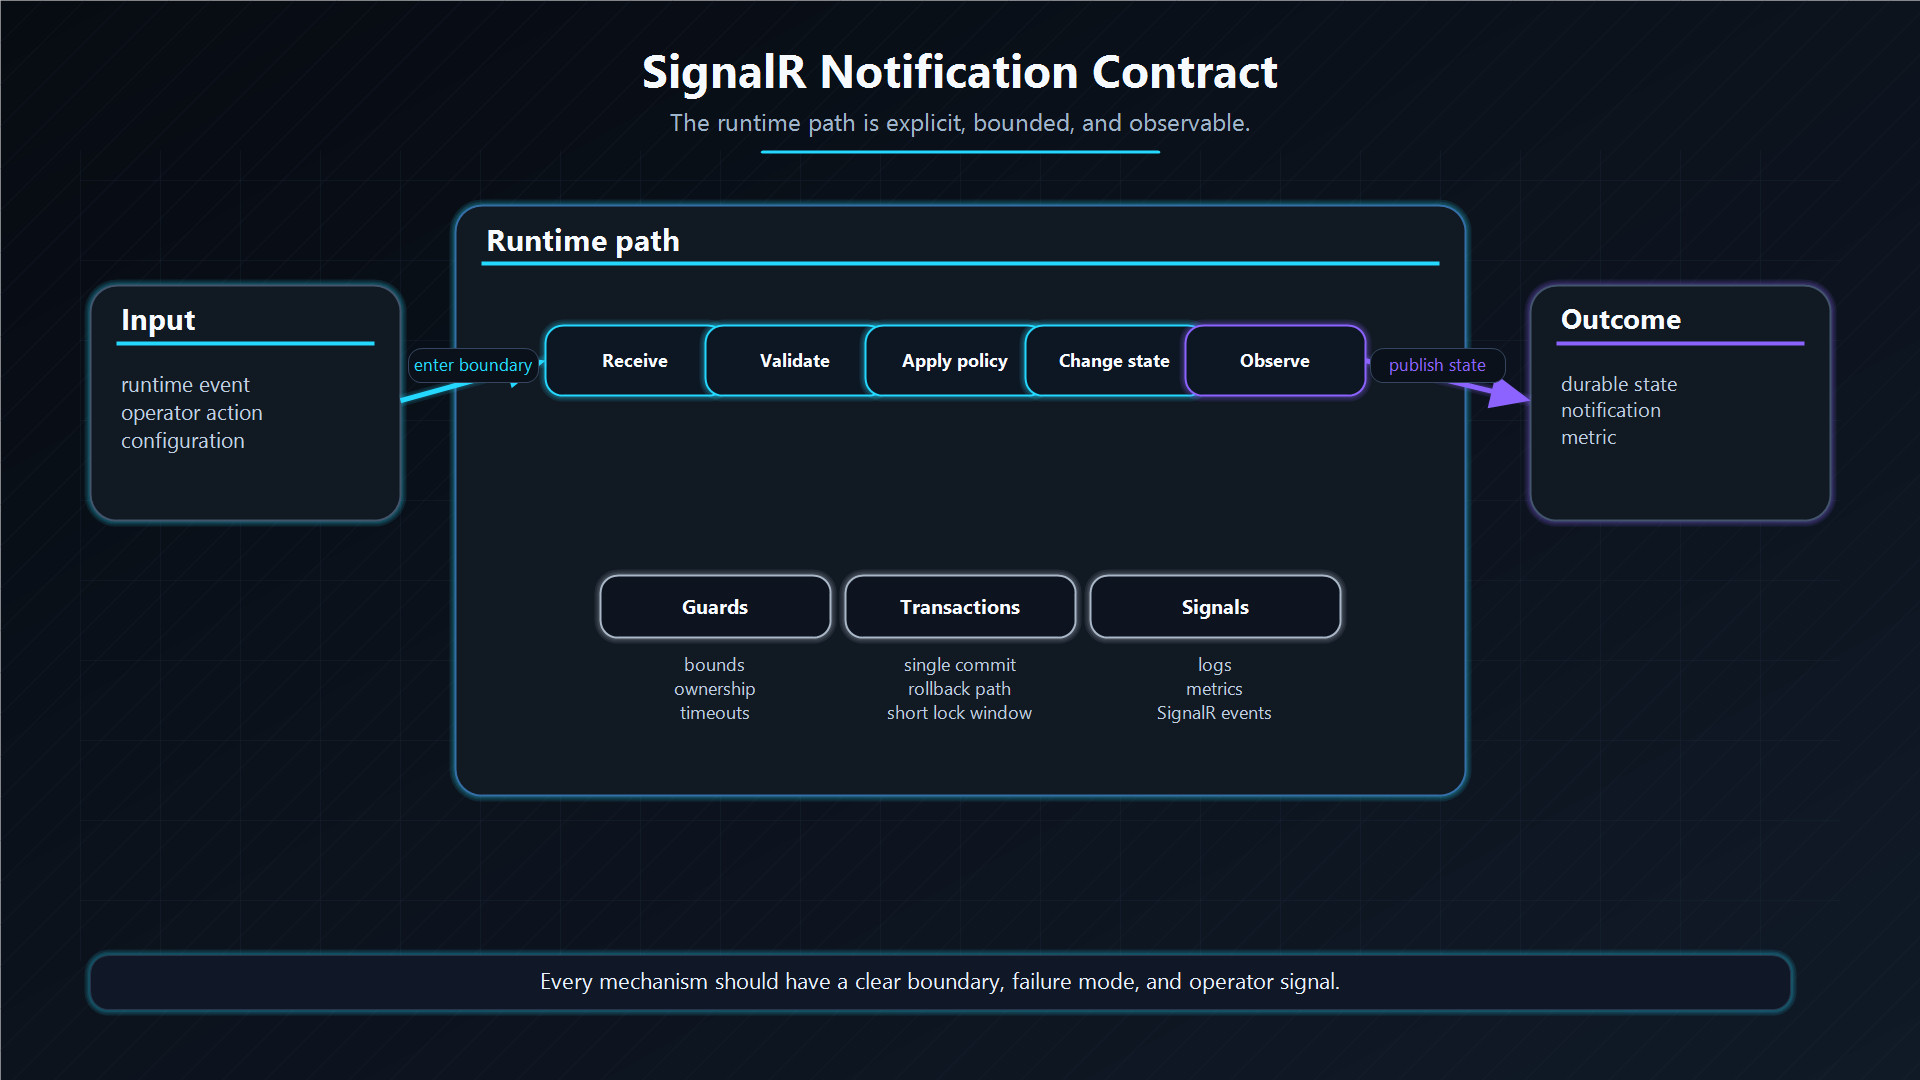
SignalR - primary live-update path для job и stats changes. Dashboard все равно имеет reconciliation path, потому что notification delivery намеренно не является частью storage transaction. Timer-driven fallback refreshes и mutation-triggered reloads single-flight, поэтому медленный storage read не overlapping'ится со следующим reconciliation request.
Это намеренно обменивает tiny refresh delay на correctness. Operator видит state, который database accepted, а не state, который browser guessed. Bulk operations тоже остаются понятными: если filtered purge удалил последний item на history page, The Deck clamp'ит view к новой last page вместо confusing empty page при counters, которые still report matching rows.
Lag colors configurable:
builder.Services.AddChokaQTheDeck(options =>
{
    options.QueueLagWarningThresholdSeconds = 5;
    options.QueueLagCriticalThresholdSeconds = 10;
});
Job Matrix
Virtualized grid показывает active jobs с color-coded status badges:
| Badge | Color | Meaning |
|---|---|---|
PENDING | Gray/Muted | Waiting in queue |
FETCHED | Blue | In worker memory buffer |
PROCESSING | Yellow/Warning | Actively executing |
SUCCEEDED | Green | Completed (in Archive view) |
FAILED | Red | Failed (in DLQ view) |
DLQ rows также показывают failure-taxonomy badge. Badge хранится как structured data, а не выводится из exception text:
| Reason | Typical Meaning |
|---|---|
FatalError | Poison pill или non-retryable handler/payload error |
Throttled | Downstream rate limit или quota pressure |
Timeout | Execution превысил runtime budget |
Transient | Retryable failure exhausted retry budget |
RetryLifetimeExpired | Retry wall-clock lifetime budget expired |
Cancelled | Explicit operator cancellation |
Zombie | Worker heartbeat expired |
Это важно операционно: throttling указывает на concurrency/quotas, timeouts - на execution budgets или downstream latency, fatal errors - на payload или code fixes.
Queue Management Panel
Runtime controls для каждой queue:
- Pause/Resume - stop fetching from a queue без влияния на in-flight jobs;
- Activate/Deactivate - completely disable a queue;
- MaxWorkers - adjust Bulkhead concurrency limit;
- Zombie Timeout - per-queue heartbeat threshold.
Circuit Breaker Monitor
Visual indicators для circuit status каждого job type:
| Indicator | State | Action |
|---|---|---|
| 🟢 | Closed | All clear - executions permitted |
| 🟡 | Half-Open | Testing - one execution allowed |
| 🔴 | Open | Blocked - countdown to reset shown |
Console Stream
Real-time log system events:
14:32:05  ✅ Job job-abc123 completed (245ms) [email_v1]
14:32:07  ❌ Job job-def456 failed: NullReferenceException [report_v2]
14:32:07  ⚡ Smart Worker: Fatal error — sent to DLQ immediately
14:33:00  ⚠️ ZombieRescue: Recovered 1 abandoned, archived 0 zombies
14:33:15  🔴 Circuit OPEN for job type "payment_v1" (5 consecutive failures)
Two visual themes
Blueprint (Default)
Engineering blueprint aesthetic: dark navy background with white grid lines:
- Background:
#003366with CSS grid overlay; - Font:
Consolasmonospace; - Borders: white with opacity;
- Glass effect with
backdrop-filter: blur(13px).
Carbon
High-contrast dark mode inspired by IBM Carbon Design System:
- Background:
#222with carbon fiber pattern; - Font:
Intersans-serif; - Borders: solid gray;
- No glass effects: solid panels.
Switch themes at runtime через theme selector в header.
SignalR notification flow
Когда job меняет state, pipeline такой:
JobProcessor completes job
    → IJobStorage.ArchiveSucceededAsync()    // Persist
    → IChokaQMetrics.RecordSuccess()         // Metrics
    → IChokaQNotifier.NotifyCompletedAsync() // Push to dashboard
        → SignalR Hub broadcasts to all connected clients
            → Blazor components re-render with new data
IChokaQNotifier - bridge между processing engine и UI. В SQL Server mode он использует SignalR. В In-Memory mode это NullNotifier (no-op).
Security
The Deck - administrative control plane: он может cancel, purge, edit, pause, deactivate и resurrect jobs. Для production привяжите его к dedicated ASP.NET Core authorization policy:
builder.Services.AddChokaQTheDeck(options =>
{
    options.AuthorizationPolicy = "ChokaQAdmin";
    options.DestructiveAuthorizationPolicy = "ChokaQWrite";
});

// Define the policy
builder.Services.AddAuthorization(options =>
{
    options.AddPolicy("ChokaQAdmin", policy =>
        policy.RequireRole("Admin"));
    options.AddPolicy("ChokaQWrite", policy =>
        policy.RequireRole("JobOperator"));
});
Если named policy не configured, The Deck все равно вызывает RequireAuthorization() и использует default policy приложения. Public access требует AllowAnonymousDeck = true, что удобно для demos, но не делает production exposure default.
AuthorizationPolicy управляет read/connect access к dashboard и SignalR Hub. DestructiveAuthorizationPolicy проверяется внутри Hub methods перед cancel, retry, resurrect, edit, purge, pause, deactivate или queue-limit changes. Если оставить его null, destructive commands используют ту же boundary, что и dashboard.
Дальше: как Edit + Resurrect позволяет восстанавливать dead jobs прямо из browser.