
Rolling Observability Buckets
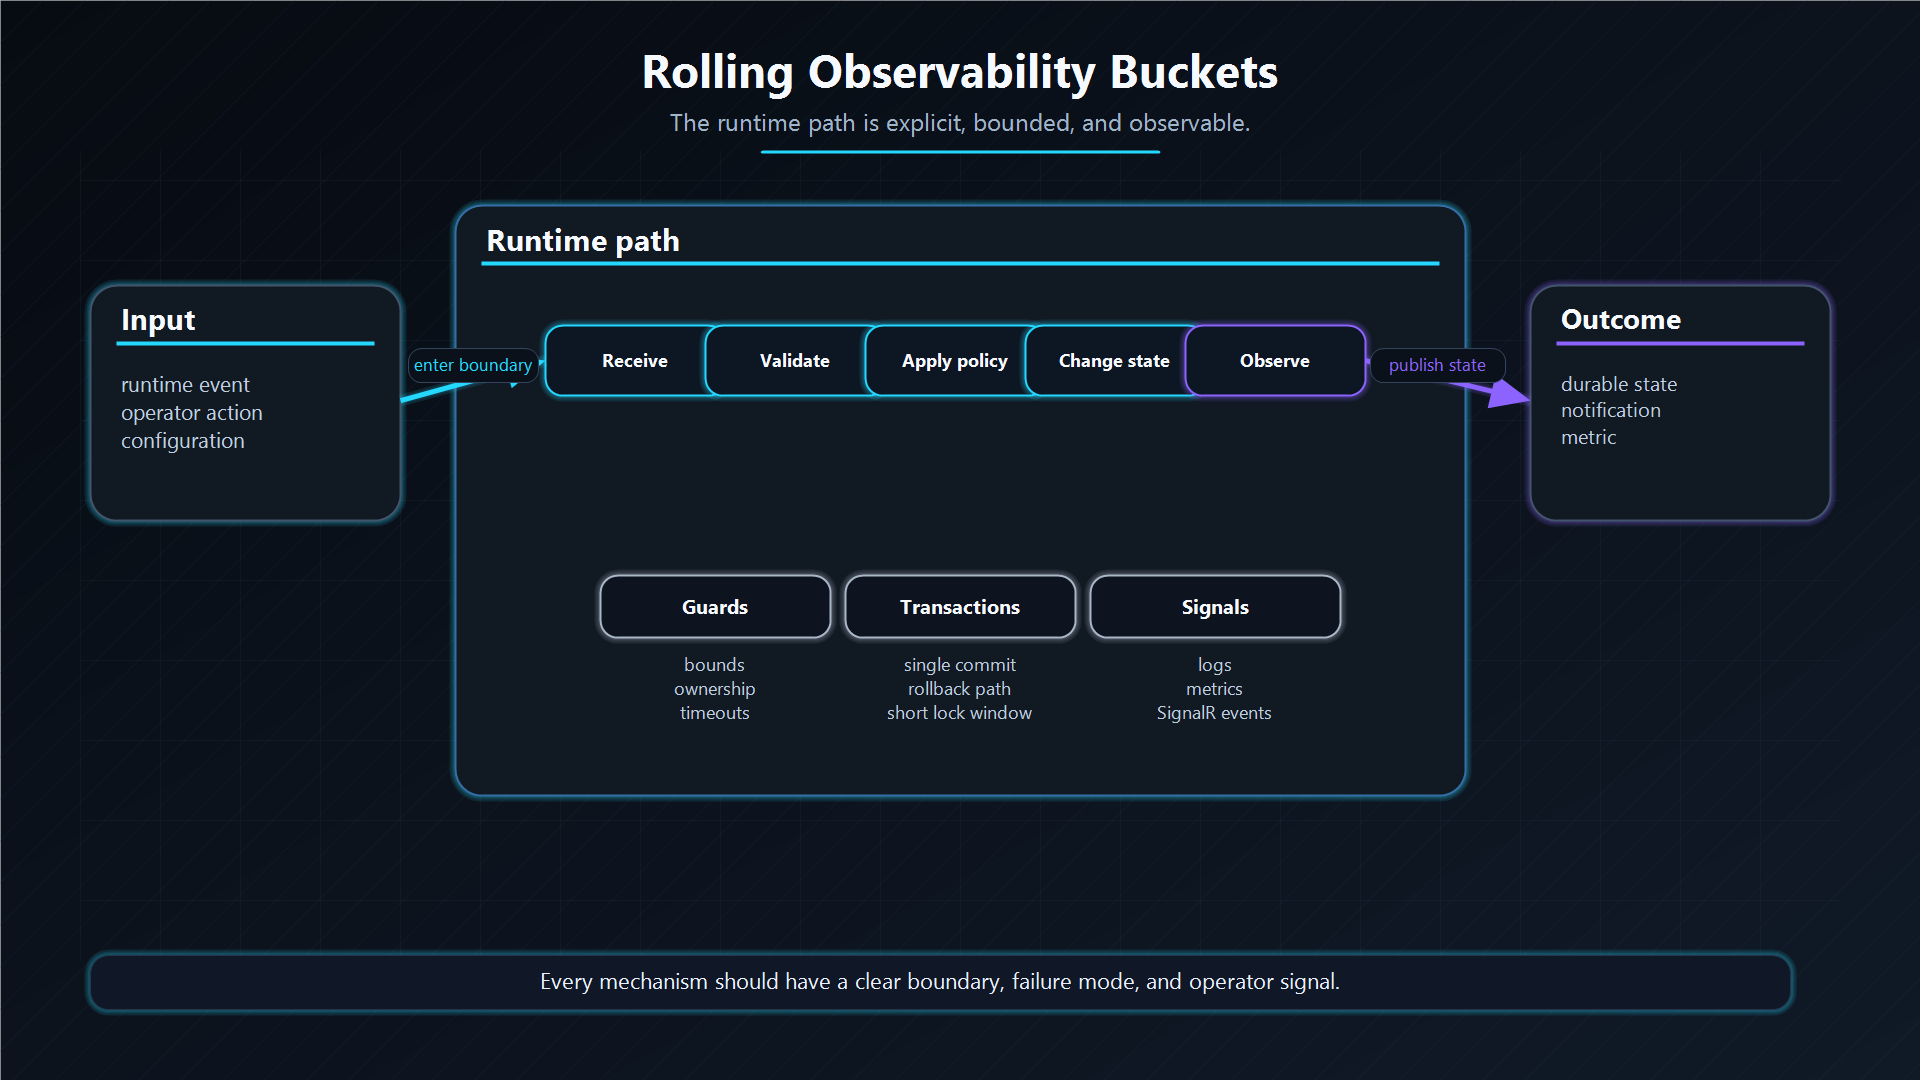
This chapter documents how ChokaQ calculates recent throughput and failure-rate signals for The Deck.
The current implementation records completion outcomes into MetricBuckets during the same transaction that moves a job to Archive or DLQ. That design keeps dashboard reads bounded and avoids scanning growing history tables on every refresh.
Version 1: Bounded History Lookback
The first implementation answered recent throughput and failure rate directly from lifecycle tables:
SELECT
    COUNT_BIG(*)
FROM [chokaq].[JobsArchive]
WHERE [FinishedAtUtc] >= @OneMinuteCutoff;

SELECT
    COUNT_BIG(*)
FROM [chokaq].[JobsDLQ]
WHERE [FailedAtUtc] >= @OneMinuteCutoff;
This was a reasonable production-preview step because it was:
- easy to reason about;
- based on the canonical job state tables;
- parameterized and bounded by time;
- able to use date indexes;
- implemented without introducing another write path.
For a small or early system, this version is often exactly where you should start. It gives real signals without inventing metrics infrastructure too early.
Where Version 1 Stops Being Enough
The bounded lookback has several limits:
| Problem | Why It Matters |
|---|---|
| History tables become metrics tables | Archive and DLQ are optimized for investigation and retention, not constant dashboard rate reads. |
| Query cost grows with retention pressure | Even indexed recent windows still couple dashboard cost to lifecycle table shape and size. |
| Requeue can rewrite recent history | If a DLQ row is resurrected, direct DLQ counting can make the failure disappear from the failure-rate window. |
| Purge affects metrics | Operational cleanup should not erase the fact that failures happened. |
| More metrics become awkward | Duration histograms, outcome families, and longer charts become hard without repeatedly scanning job history. |
The most important semantic issue is requeue. A job can fail, land in DLQ, get fixed by an operator, and be moved back to Hot. The DLQ row is gone, but the failure event still happened. Failure rate should describe recent processing outcomes, not the current contents of the DLQ table.
Version 2: MetricBuckets
The next design separates lifecycle history from rolling observability:
Hot -> Archive transaction
    writes JobsArchive
    increments StatsSummary
    increments MetricBuckets

Hot -> DLQ transaction
    writes JobsDLQ
    increments StatsSummary
    increments MetricBuckets
MetricBuckets stores small aggregate rows:
CREATE TABLE [chokaq].[MetricBuckets](
    [BucketStartUtc]  datetime2(0) NOT NULL,
    [Queue]           varchar(255) NOT NULL,
    [Outcome]         tinyint      NOT NULL,
    [FailureReason]   int          NOT NULL,
    [CompletedCount]  bigint       NOT NULL,
    [DurationCount]   bigint       NOT NULL,
    [TotalDurationMs] float        NOT NULL,
    [MaxDurationMs]   float        NULL,
    [LastUpdatedUtc]  datetime2(7) NOT NULL
);
The bucket is currently one UTC second. That is precise enough for 1-minute and 5-minute dashboard windows without storing one metrics row per job.
Why MetricBuckets Became The Next Step
The dashboard now reads this shape:
SELECT
    SUM(CASE WHEN [BucketStartUtc] >= @OneMinuteCutoff
             THEN [CompletedCount] ELSE 0 END) AS ProcessedLastMinute,
    SUM(CASE WHEN [BucketStartUtc] >= @OneMinuteCutoff AND [Outcome] = 1
             THEN [CompletedCount] ELSE 0 END) AS FailedLastMinute,
    SUM([CompletedCount]) AS ProcessedLastFiveMinutes,
    SUM(CASE WHEN [Outcome] = 1
             THEN [CompletedCount] ELSE 0 END) AS FailedLastFiveMinutes
FROM [chokaq].[MetricBuckets]
WHERE [BucketStartUtc] >= @FiveMinuteCutoff;
The practical benefits are:
- The dashboard reads tiny time buckets instead of lifecycle history.
- Requeue and purge no longer erase recent outcome events.
- The cost of throughput/failure-rate reads is tied to bucket count, not Archive or DLQ retention.
- The write is transactionally coupled to the final state transition.
- Future charts can reuse the same bucket table.
- Duration aggregates are available without rescanning Archive.
Trade-Offs
This design improves the operational read model, but it is not free:
| Cost | Mitigation |
|---|---|
| More write work on finalization | The bucket update happens in the same SQL transaction and groups rows by queue/outcome. |
| More schema surface area | The table has a clear single responsibility: rolling operational aggregates. |
| Possible hot bucket contention | Second-level buckets reduce contention compared with minute buckets while keeping reads small. |
| Existing history needs backfill if upgraded in place | ChokaQ treats new buckets as the source of truth from the moment the schema is installed. A future migration can backfill if needed. |
The enterprise lesson is not "always start with buckets." The lesson is: start with the simplest correct signal, then graduate when correctness, operational cost, or semantics demand a better boundary.
Separation Of Concerns
ChokaQ now uses three different read models for three different questions:
| Question | Source |
|---|---|
| How many jobs have ever succeeded or failed? | StatsSummary |
| Which jobs succeeded or failed, and why? | JobsArchive / JobsDLQ |
| How fast is the system processing right now? | MetricBuckets |
That separation is the real architectural improvement. Each table now has a job, and the dashboard no longer asks one table to answer every operational question.
Architecture Decision
ChokaQ keeps rolling observability separate from lifecycle history because the questions are different. Archive and DLQ tables answer "what happened to this job?" Metrics buckets answer "what is the system doing right now?" Combining those concerns forces dashboard refreshes to scan tables whose main purpose is audit and investigation.
The chosen design writes a tiny aggregate event at the same point where the job reaches a terminal state. That preserves the outcome even if an operator later resurrects or purges a DLQ row. Recent failure rate remains a fact about recent execution, not a side effect of current DLQ contents.
The trade-off is an additional write during finalization. ChokaQ accepts that because finalization is already a transactional boundary, and bounded dashboard reads are more important than avoiding one small aggregate update.
Additional Questions
Why not compute dashboard rates directly from Archive and DLQ forever?
Because those tables grow with retention and operator workflows. Requeue and purge can also change their contents after the failure event happened.
Why are buckets written in the terminal-state transaction?
So lifecycle state and operational metrics cannot disagree because of a partial write. If the job reached Archive or DLQ, the corresponding rolling outcome is recorded with it.
What would you change at very high scale?
Potential next steps are coarser bucket partitions, asynchronous metrics export, or database-specific upsert tuning. The current design keeps the first production model simple and query-bounded.